


The Revolving Dynamic Link
The "Revolving Dynamic Link" program logic is the controller and user interface of the "Green Revolution Energy Converter". It controls the movement of the “Work Generating Volume” over the hot, the insulating and the cold surfaces of the Carnot engine by controlling the rotation of the “Revolving Shutter”. The Revolving Dynamic Link (RDL) software also writes a time stamped log while measuring:
• the internal pressure of the system in relation to the position of the Work Generating Volume
• mean values of the Work Generating Volume temperature in 4 positions
• temperatures of the heat conducting surfaces in 6 positions
The movement of the “Work Generating Volume” (WGV) over the hot, insulating and cold surfaces is totally dynamic. This gives the obvious advantages of a fully controlled start, an exact control of the speed and the ability to stop the Green Revolution Energy Converter (GREC) in any instant. The Revolving Dynamic Link (RDL) logic controls the position of the Revolving Shutter (RS) depending on its current physical input or from operator input.
WHAT VARIABLES DO WE WANT TO CONTROL AND MEASURE?
First step
There are many ways to generate power from the pressure pulses generated by the GREC. The focus of the RDL software is "A new way to use an electric motor to move a Work Generating Volume (WGV) of gas between a heat source and a cold sink to get controlled pressure pulses". So we aim to optimise the pressure pulses but we leave the power generation until later. In our first GREC “Woody” Lab Model we succeeded with the control task to start and stop the Revolving Shutter (RS) containing the WGV and also to revolve a predefined number of turns at a predefined speed, but logging of pressure was done externally and we only had external mean temperatures of the heat source and the cold sink. Our first “Woody” Lab Model stopped working before we had enough of data to predict how much heat the conducting fins were able to distribute to and from the WGV at different speeds. With the new GREC Lab Model 2.0 we want our RDL software to help us answer questions like:
- Do we have cold and heat enough to get pressure pulses?
- How fast can we go? What RPM (Revolutions Per Minute) or what Hertz?
- What RPM delivers the highest output?
- What RPM delivers the best efficiency?
- For how long (time) can the GREC deliver pulses at this speed? (pressure difference of single pulses expects to fall at a higher frequency)
Above questions needs a real-time study of frequency (RPM or Hertz) and amplitude.
Second step
The values of the above real-time study is needed to get prepared for calculating a GREC prototype that delivers pulses that can generate more than 60kW from a well defined existing temperature difference. With proven real data we may start looking for a Green Revolution Energy Converter Thermal Application (GRETA) like waste heat form an industrial process or waste heat from computer hall or thermal solar panel with ambient air as cooling etc... There are loads of them, but we have decided to prioritise the ones without combustion. No CO2 emissions!
Third step
This will point at obvious solutions to generate different types of power from our fully controlled pressure pulses. Solutions to real life emission free applications. Now we are talking about a future third and optional step. So future development projects will deal with power output like using pressure pulses at a desired frequency to:
- operate a linear dynamo to generate electrical power
- operate a piston to pump
- operate a piston to hammer
- use the vibration as it is
- get a circular movement with the use of a piston and flywheel to get mechanical power (transport)
- get a circular movement with the use of a piston and flywheel to generate electrical power
- get piezo electrics to generate power
- e.t.c (the list is long...)
So today we are still focusing on the first step with basic functions like starting, stopping and controlling the movement of the WGV and we want to know exactly how the pressure pulses relates to the temperature gradient and the revolving speed of the WGV. In short, we need to do the “real time frequency and amplitude study”. To get a clear picture we have installed 10 internal and 2 external thermistors, 4 internal hall sensors for position and two pressure sensors. The frequency and amplitude study will indicate the bottlenecks of the energy flow and give a better understanding on how to scale the geometry (WGV and heat conducting fins) of the GREC in relation to a given application delta T.
The RDL system includes sensors for:
- temperatures T high and T low at the heat source, the cold sink, 3 radial points on both the middle conducting fins measuring the metal surface temperature, 2 points on both of the middle insulating fins measuring the WGV temperature.
- instantaneous pressure measurements in two adjacent points of the total system volume
- desired positive or negative speed of the revolving shutter
If we, later on, connect a linear electric generator, or a piston and a flywheel, or anything else that connects and uses the frequented pressure variations, we would like feed back from separate angle and position sensors to indicate:
- the position of the piston and the flywheel (angle) and their load of a generator.
- desired position (angular) for the WGV (T high, Nil or T low)
We will also be able to rotate the WGV at different speeds within a revolution and o park the WGV in any specific position.
(Need anything else to be able to run the prototype and obtain data?)
THE SYSTEM CONFIGURATION
 First versions of the system were able to log the heat source and cold sink temperature during start of the RS, revolving the WGV for a specified time at a certain speed and then stopping the RS. Logging the pressure was done by filming a water gauge with millimetre scale during the program run and then putting it all together in a spread sheet. Rudimentary but it resulted in very encouraging facts when running with our first Lab Model version 1 (the "woody" model). Unfortunately the Revolving Shutter of the woody model got stuck because of humidity problems, so we were not able to continue with these test runs. But the Revolving Dynamic Link software development continued during the construction of the new GREC Lab Model v2.
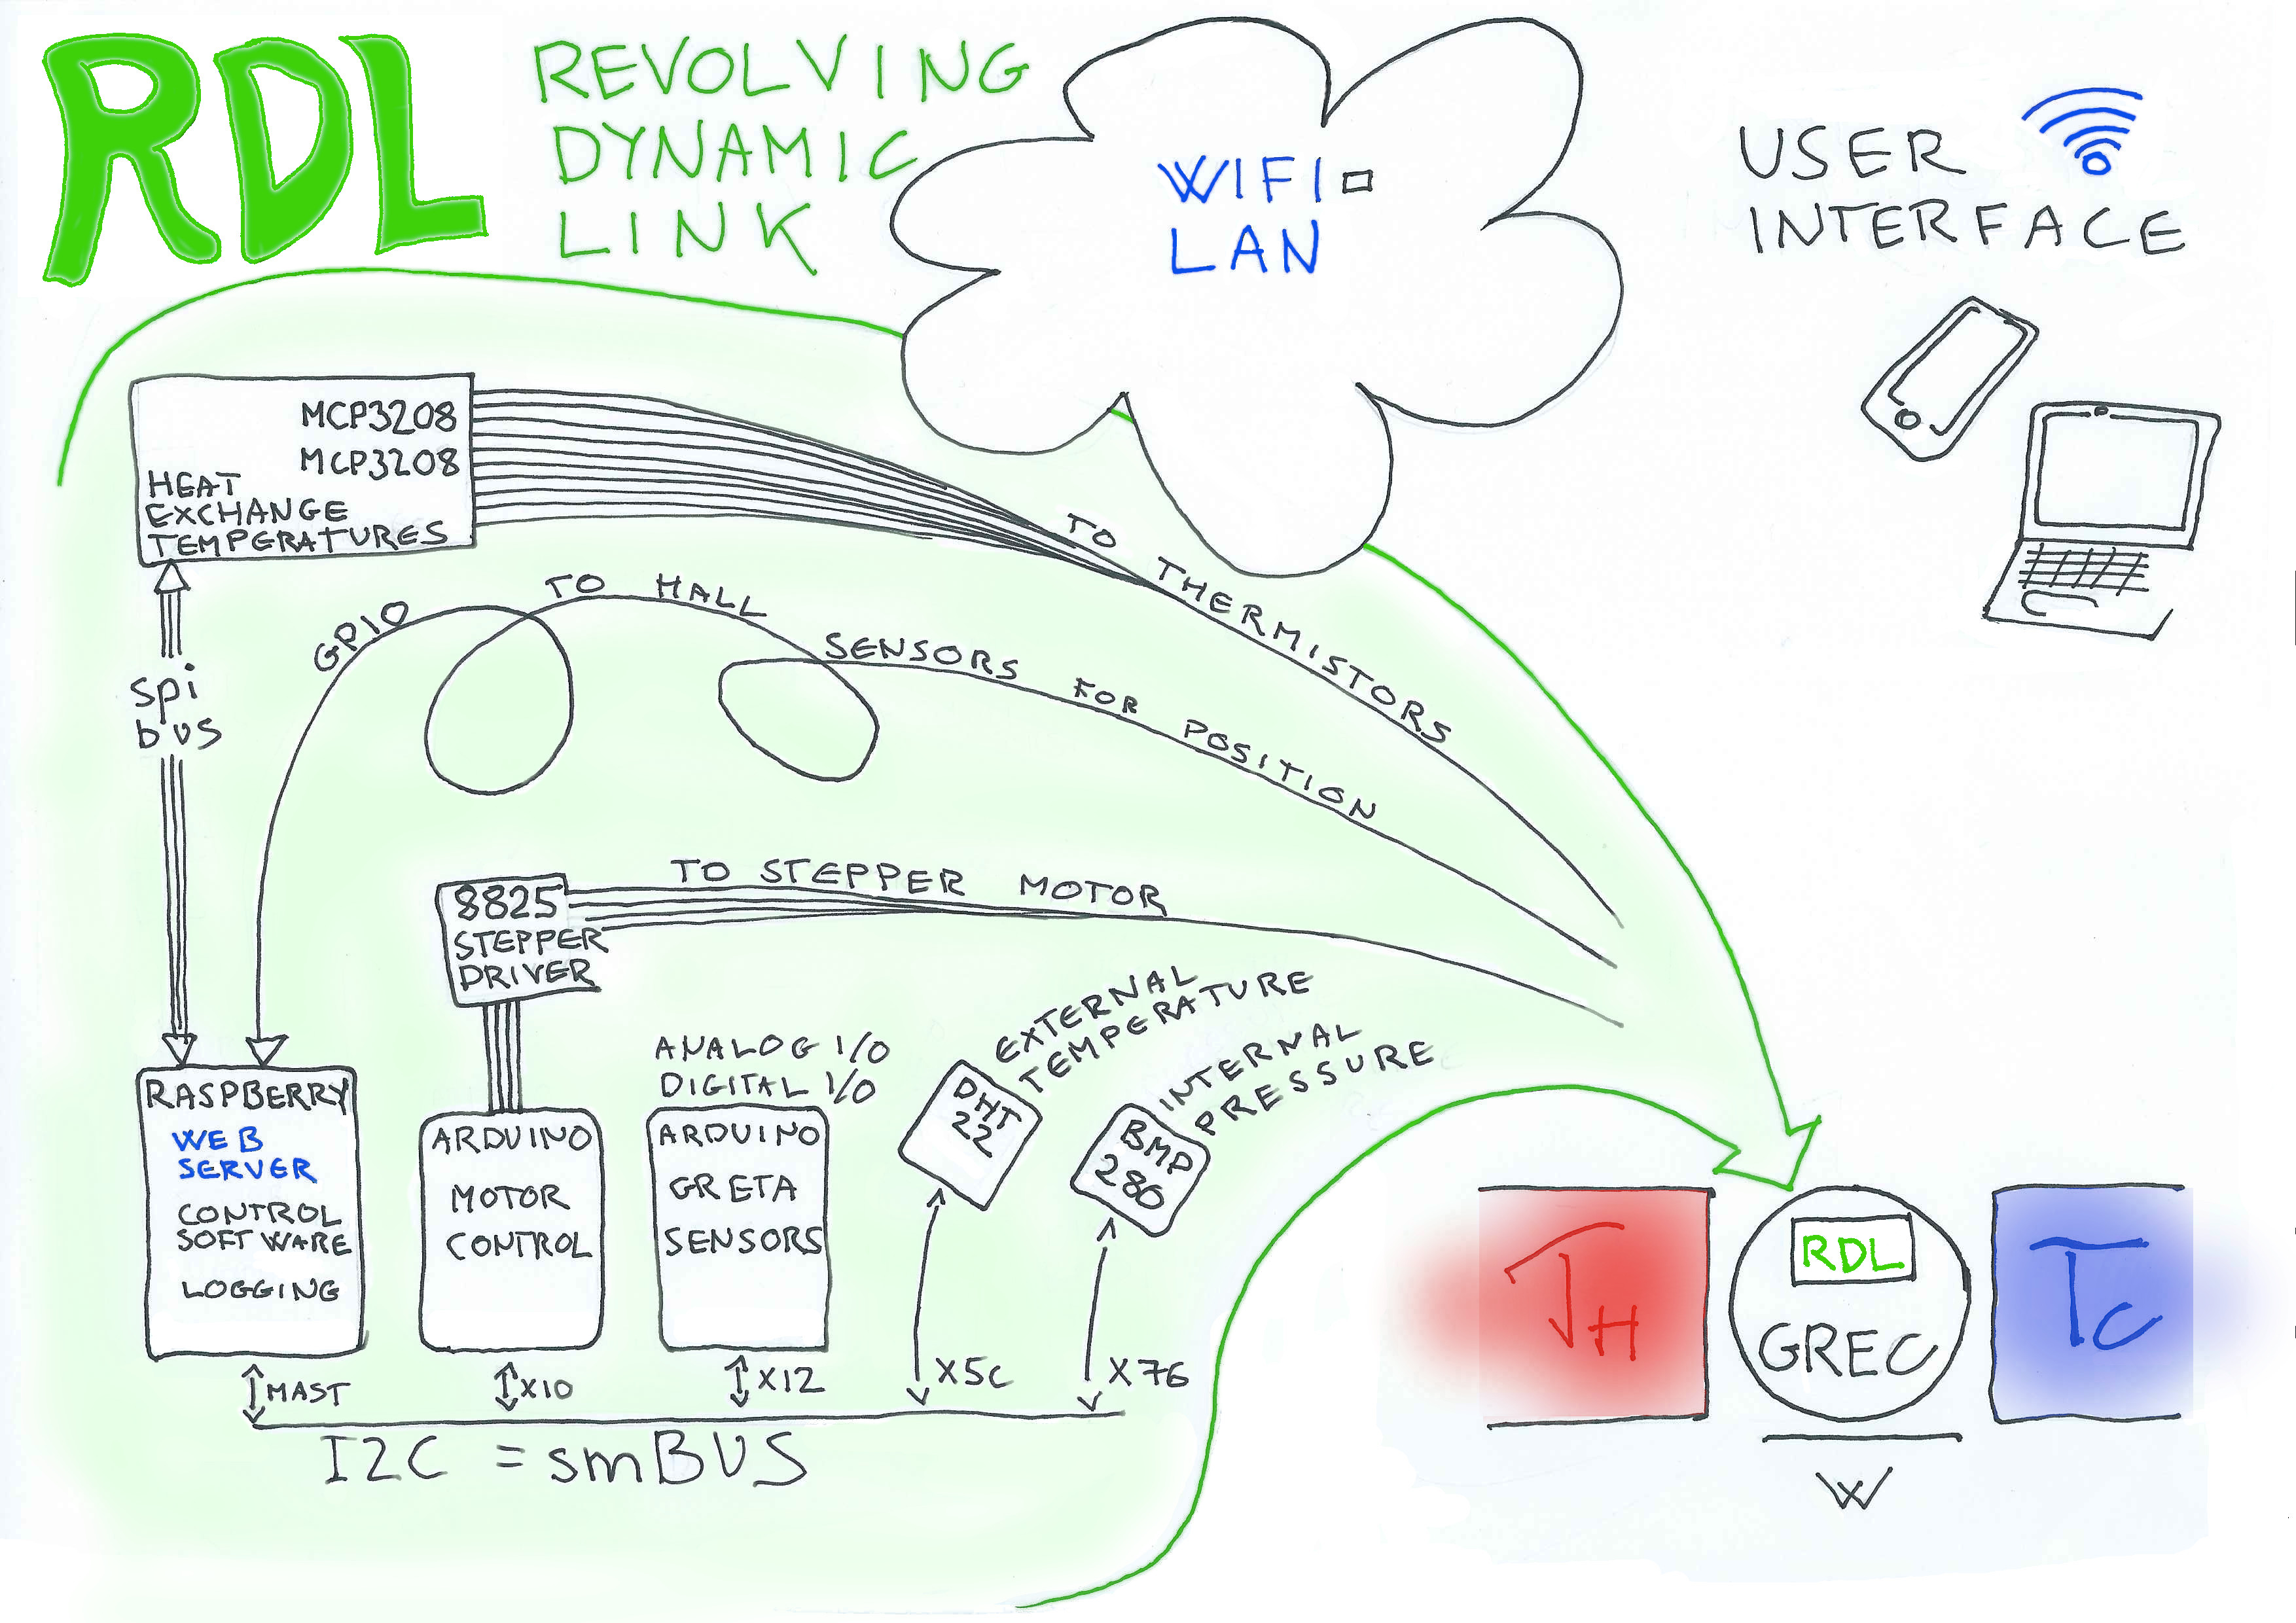
Today’s version of the system 2018-05-28 is called "BriefcaseSetup15" because it was developed with all its components in a small document briefcase including one Raspberry Pi 3+ and two Arduino controllers a stepper motor and two MCP3208 A/D converters. The relationship Rasperry Pi3 and Arduino is that the Raspberry Pi3 is a complete web server with the development environment that is responsible for data collection and overall control while the two Arduino Uno are controling the Stepper Motor and reports back the Stepper Motor parameters (number of steps, position, ...)
-On the RPi3 we start /home/pi/DynLink18/thermistPt519.py by using Python 3
This program communicates on I2C with the first Arduino on channel 0x10 with the Stepper Motor driver software, and the user interface is localhost on the same RPi3 local web server normally at 192.168.xxx.yyy that you reach with any browser on the LAN at http://192.168.xxx.yyy/motor.html (where xxx.yyy is the actual IP address of the local LAN)
Also start the /home/pi/DynLink18/feu.py on the same Rpi3, also by using Python 3 in the same manner. This also communicates on I2C but with the second Arduino on channel 0x12 with three LEDs connected and the software feu_i2c.ino, and your user interface is at the same localhost on the local web server that you reach on the LAN at http://192.168.xxx.yyy/feu.html
First lines of the Raspberry Pi 3 thermistPt5xx.py code explains the connections:
#!/usr/bin/python
# -*- coding: utf-8 -*-
# thermistPt519.py
# internet connected Raspberry Pi 3 web server with
# - spi using chip select addressing two MCP3208 with Pt500 thermistors
# - GPIO connected hall sensors for position triggering of data logging
# - I2C (smBUS) connected with :
# Arduino "0x10" AA with a stepper driver card 8825 and
# Arduino "0x12" AB with feu_i2c.ino software and a humidity/temperature sensor.
# DHT22 "0x5c" prepared to measure environmental humidity/temperature
# BMP280 "0x76" with function from ryker1990 BME280.py to read pressure
# Rpi3 pin 3 (SDA) connects to Arduino pin A4
# Rpi3 pin 5 (SCL) connects to Arduino pin A5
#
# This program regularly reads the file /var/www/html/MOTORstate.txt and
# checks what number (0-127) it contains. Number = 1 acts as an on/off switch.
# It sends the number over I2C to Arduino 0x10 who acts and responds back immediately.
# This program prints the log and the I2C dialogues for monitoring
#
# 1 - on Arduino AA run IDE the program drv8825Ra04.ino
# on Arduino AB run IDE program feu_12c.ino
#
# 2 - check that smBUS is up with: $ i2cdetect -y 1
# ($ man i2cdetect)
#
# 3 - $ cd DynLink18
#
# 4 - $ python3 thermistPt519.py
#
# 5 - $ python3 feu.py
#
# Control the applications on pages motor.html and feu.html in a browser
# with the correct Raspberry Pi 3 web server local address 192.168.X.Y
#
# All printing is done in the bottom loop and will be logged in a file,
# Four hall sensors will activate bottom loop. Think that the
# instruction pull_up_down=GPIO.PUD_UP is difficult to grasp!
# The redLedPin lights up the led in the bottom loop.
# To do :
# - add constants in logg function to calibrate individual thermistors
# - and adding pressure reading
# Not happy with writeFile(logfile, westvalue) being the only line with LF
#
# Not happy with communication 0 to stop
# Use the mechanism of the redLedPin that lights up the led in the bottom loop.
#
# thermistors need both calibration in function and rapid mean value to avoid
# extreme fluctuations due to power variations(?)